
Uncertainty persistence versus economic resiliency
Chief Economist Eugenio J. Alemán discusses current economic conditions.
The US economy has had to endure many changes in policies that have tested its resilience during the year. In this environment, which has been ever-changing, two sectors of the economy have kept the economy above ground. The first one is the US consumer, which, as we know, is not only the largest component of GDP but also the most stable one. Not that consumers have not been challenged during the year, because they have, especially at the middle to low-income levels. However, at the upper middle- and higher-income levels, an accumulation of savings during the early part of the year, as well as the surge in wealth due to the strength of the US stock market, has provided enough support to keep demand going.
It was also true that up to the early part of the summer, employment growth supported consumption at every level of income, while the rate of unemployment remained at what is typically called full employment. That is, having a job meant that, even if your situation wasn’t optimal, it was going to allow you to continue to pay your bills and keep the ball rolling. The second sector that has remained strong is nonresidential investment, a sector that has been booming due to the recent construction of so many new factories. These factories are now in the process of being stocked with the technology and equipment needed for operations. Also, the recent acceleration in investment in AI, has energized not only the stock market, but also real investment in information processing equipment and software.
However, the recent downward revision of employment numbers, weakening of the private employment ADP survey number, and the increase in the rate of unemployment are starting to raise eyebrows about how much longer consumers can keep up the current pace of demand. In fact, despite a recent uptick, small business hiring plans have been on a steady decline since 2022 and remain at historically low levels. This week’s consumer confidence data revealed a further increase in the number of people who believe jobs are hard to get, reaching levels not seen since 2021. Meanwhile, the share of respondents who view jobs as “plentiful” dropped to 26.9%, the lowest since February 2021.
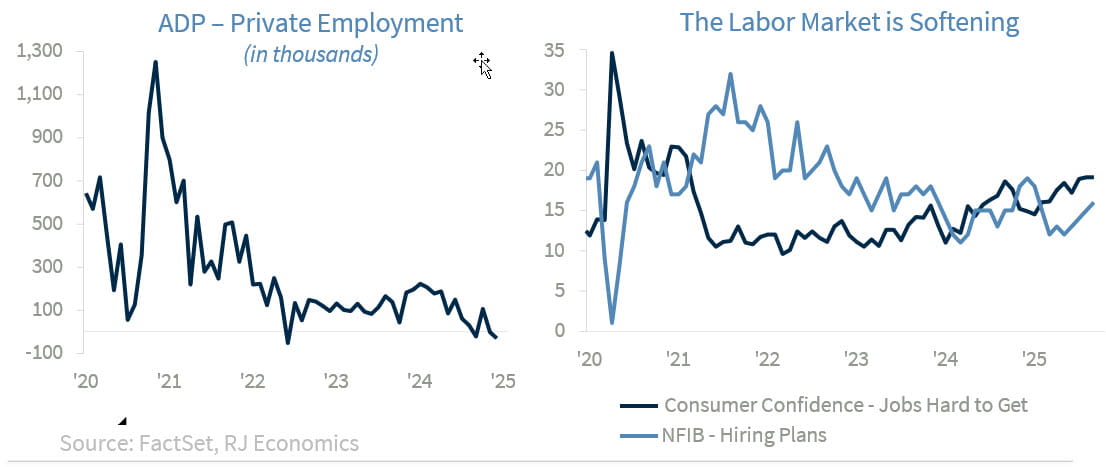
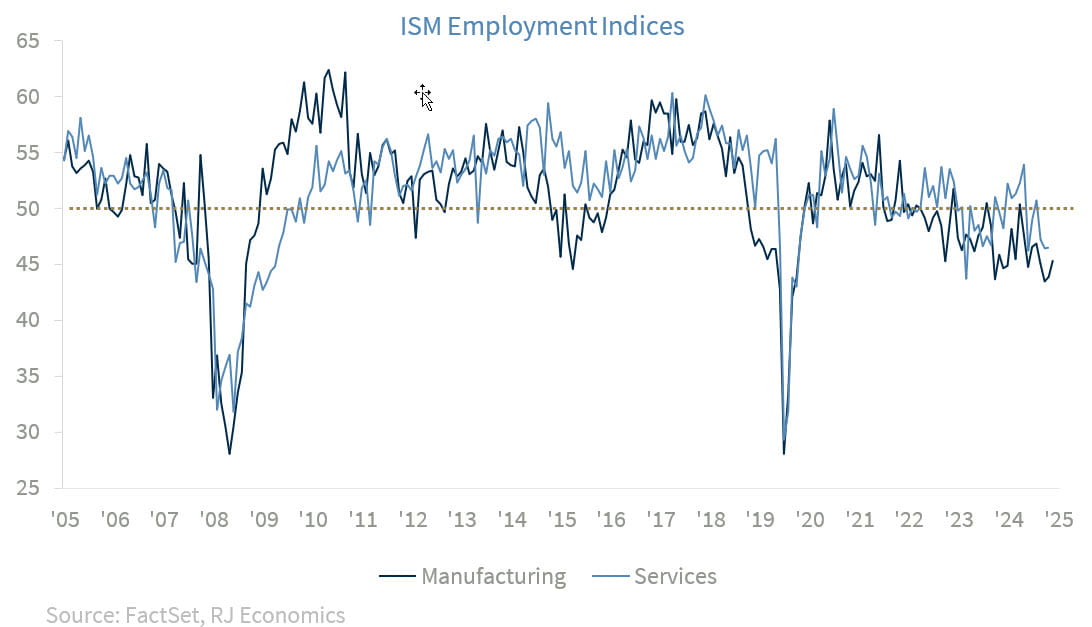
Both ISM employment indices have remained in contraction for several months and continue to signal weakness in labor demand. Additionally, the three-month average of job openings has fallen to its lowest level since February 2021, while the hires average is now at its lowest point since the pandemic, or 2015, if we exclude COVID-related distortions.
If this wasn’t enough, the current government shutdown is going to add to this uncertainty, especially during a period when labor indicators are all blinking yellow. We know that not many people have confidence in the job numbers being published today by US statistical agencies, but the numbers being published by private agencies are not much better. At the same time, the majority of the numbers being produced by private companies/institutes are partial, mostly soft data, and they seldom have broad-base coverage, as is the case for those reported by US statistical agencies.
Yes, they are partially useful in trying to make sense of what is happening in the US economy, and we use them as complementary to official numbers. But they lack the depth, breadth, and insight official numbers provide for decision-making purposes, even if official numbers are prone to large revisions, as we have seen over the last several months.
In summary, although the US economy has remained resilient in the face of increased uncertainty regarding new policies, today, more than ever, economic decision makers need more data, not less, and the federal government shutdown is not making things easy. Thus, we hope that the political class realizes the risks posed to the economy and comes to a negotiated agreement on the need to reopen the government, even if it is only to allow our statistical agencies to release badly needed economic indicators.
That is, our view is that statistical agencies’ work is essential, and we should keep them open even during government shutdown periods.
Economic and market conditions are subject to change.
Opinions are those of Investment Strategy and not necessarily those of Raymond James and are subject to change without notice. The information has been obtained from sources considered to be reliable, but we do not guarantee that the foregoing material is accurate or complete. There is no assurance any of the trends mentioned will continue or forecasts will occur. Past performance may not be indicative of future results.
Consumer Price Index is a measure of inflation compiled by the US Bureau of Labor Statistics. Currencies investing is generally considered speculative because of the significant potential for investment loss. Their markets are likely to be volatile and there may be sharp price fluctuations even during periods when prices overall are rising.
Consumer Sentiment is a consumer confidence index published monthly by the University of Michigan. The index is normalized to have a value of 100 in the first quarter of 1966. Each month at least 500 telephone interviews are conducted of a contiguous United States sample.
Personal Consumption Expenditures Price Index (PCE): The PCE is a measure of the prices that people living in the United States, or those buying on their behalf, pay for goods and services. The change in the PCE price index is known for capturing inflation (or deflation) across a wide range of consumer expenses and reflecting changes in consumer behavior.
The Consumer Confidence Index (CCI) is a survey, administered by The Conference Board, that measures how optimistic or pessimistic consumers are regarding their expected financial situation. A value above 100 signals a boost in the consumers’ confidence towards the future economic situation, as a consequence of which they are less prone to save, and more inclined to consume. The opposite applies to values under 100.
Certified Financial Planner Board of Standards Center for Financial Planning, Inc. owns and licenses the certification marks CFP®, CERTIFIED FINANCIAL PLANNER®, and CFP® (with plaque design) in the United States to Certified Financial Planner Board of Standards, Inc., which authorizes individuals who successfully complete the organization’s initial and ongoing certification requirements to use the certification marks.
Links are being provided for information purposes only. Raymond James is not affiliated with and does not endorse, authorize or sponsor any of the listed websites or their respective sponsors. Raymond James is not responsible for the content of any website or the collection or use of information regarding any website's users and/or members.
GDP Price Index: A measure of inflation in the prices of goods and services produced in the United States. The gross domestic product price index includes the prices of U.S. goods and services exported to other countries. The prices that Americans pay for imports aren't part of this index.
Employment cost Index: The Employment Cost Index (ECI) measures the change in the hourly labor cost to employers over time. The ECI uses a fixed “basket” of labor to produce a pure cost change, free from the effects of workers moving between occupations and industries and includes both the cost of wages and salaries and the cost of benefits.
US Dollar Index: The US Dollar Index is an index of the value of the United States dollar relative to a basket of foreign currencies, often referred to as a basket of U.S. trade partners' currencies. The Index goes up when the U.S. dollar gains "strength" when compared to other currencies.
The FHFA HPI is a broad measure of the movement of single-family house prices. The FHFA HPI is a weighted, repeat- sales index, meaning that it measures average price changes in repeat sales or refinancings on the same properties.
Import Price Index: The import price index measure price changes in goods or services purchased from abroad by U.S. residents (imports) and sold to foreign buyers (exports). The indexes are updated once a month by the Bureau of Labor Statistics (BLS) International Price Program (IPP).
ISM Services PMI Index: The Institute of Supply Management (ISM) Non-Manufacturing Purchasing Managers' Index (PMI) (also known as the ISM Services PMI) report on Business, a composite index is calculated as an indicator of the overall economic condition for the non-manufacturing sector.
The ISM Manufacturing Index: The GDP Now Institute of Supply Management (ISM) Manufacturing Measures the health of the manufacturing sector by surveying purchasing managers at manufacturing firms. The survey asks about current business conditions and expectations for the future, including new orders, inventories, employment, and deliveries.
Consumer Price Index (CPI) A consumer price index is a price index, the price of a weighted average market basket of consumer goods and services purchased by households.
Producer Price Index: A producer price index (PPI) is a price index that measures the average changes in prices received by domestic producers for their output.
Industrial production: Industrial production is a measure of output of the industrial sector of the economy. The industrial sector includes manufacturing, mining, and utilities. Although these sectors contribute only a small portion of gross domestic product, they are highly sensitive to interest rates and consumer demand.
The NAHB/Wells Fargo Housing Opportunity Index (HOI) for a given area is defined as the share of homes sold in that area that would have been affordable to a family earning the local median income, based on standard mortgage underwriting criteria.
Conference Board Coincident Economic Index: The Composite Index of Coincident Indicators is an index published by the Conference Board that provides a broad-based measurement of current economic conditions, helping economists, investors, and public policymakers to determine which phase of the business cycle the economy is currently experiencing.
Conference Board Lagging Economic Index: The Composite Index of Lagging Indicators is an index published monthly by the Conference Board, used to confirm and assess the direction of the economy's movements over recent months.
New Export Index: The PMI New export orders index allows us to track international demand for a country's goods and services on a timely, monthly, basis.
Gold is subject to the special risks associated with investing in precious metals, including but not limited to: price may be subject to wide fluctuation; the market is relatively limited; the sources are concentrated in countries that have the potential for instability; and the market is unregulated.
The Conference Board Leading Economic Index: Intended to forecast future economic activity, it is calculated from the values of ten key variables.
Source: FactSet, data as of 7/25/2025
